
Using the detail display in White Cup BI
When drilling down into detail display, the drill down and the columns are added to the report. These new columns are available for sorting, filtering, and other column related functions by clicking on the column headers.
How to use the detail display
In BI, any value displayed in blue is clickable. Clicking on a blue hyperlink will offer you options to dive deeper into the data through filters or other dashboards.
This is a basic report. It shows the sales for the current month and is drilled down to show how each sales rep contributed to that company total.
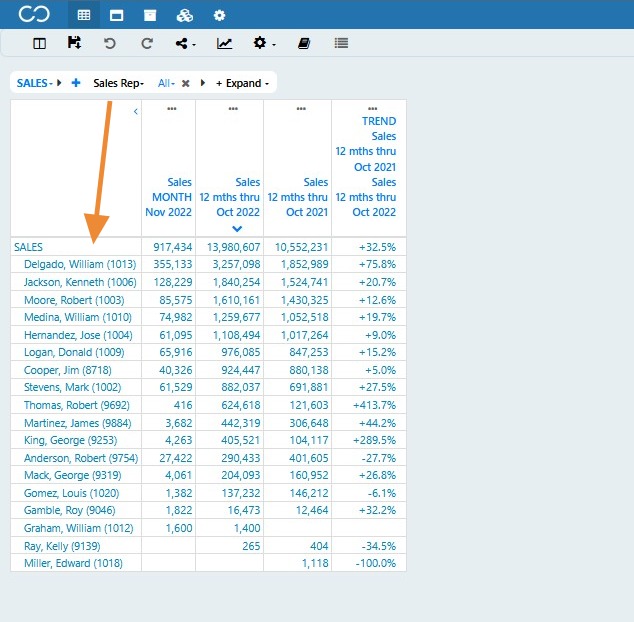
- When viewing a grid report, clicking a number in a column will display the individual invoice lines, PO lines, or other detail lines which went into accumulating that number. To see the details of any given sales rep, click the value in the column (such as $355,133).
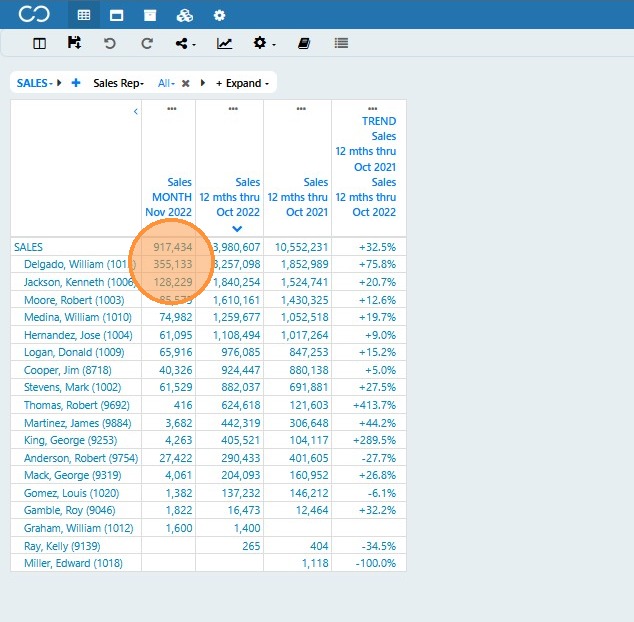
- This will automatically filter the identifier drill down (in this example it is Sales Rep) to just that value, and then add the detail display columns to the grid.
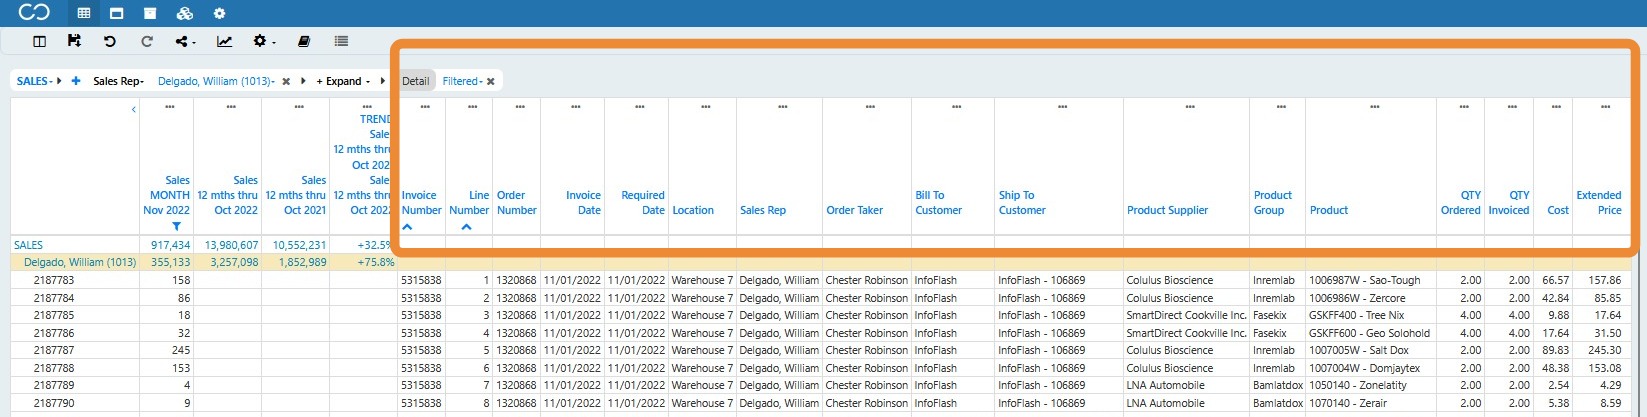
- All of the additional columns can be modified by clicking on the column header and selecting the action you wish to take, such as filter, rename the heading, or sort.
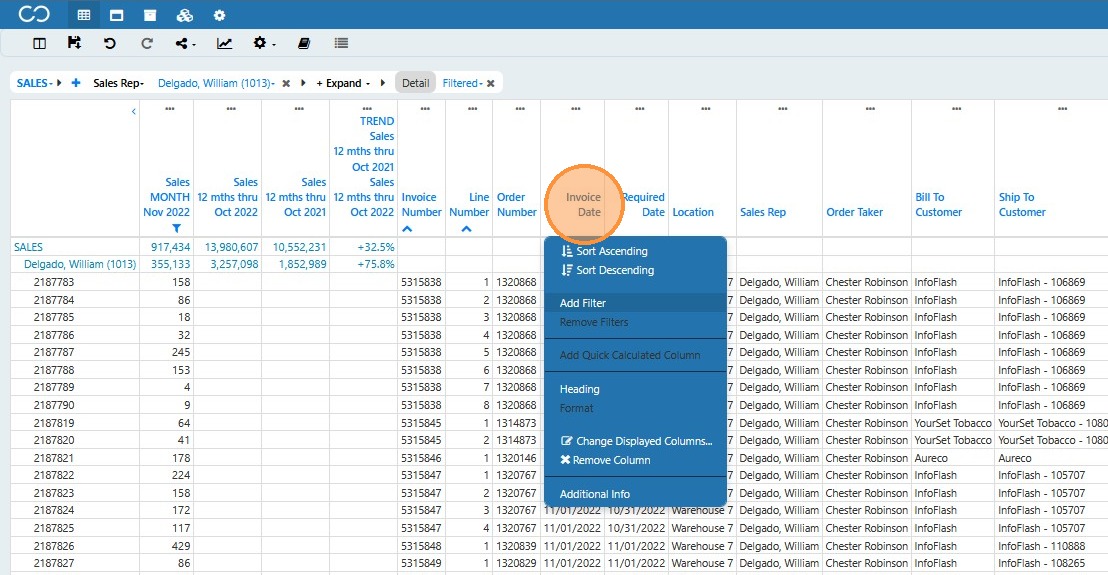
- Because the main grid report was filtered to the EON of Current Month, when the detail lines are added, the main date column (Invoice Date for the SALES hypercube) is automatically filtered to that same time period. This is indicated with the filter icon displayed in the column header. However you can modify this filter to be a larger or smaller range than the EON being used in the main grid report.
This means it is possible to show more detail lines than covered by the main grid report and could subtotal to a different value than the one displayed in the report.
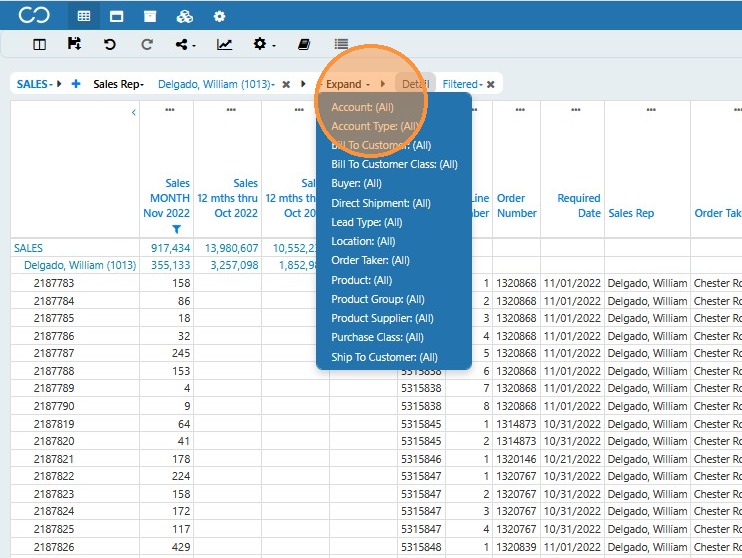
When drilled down to the detail level, this is noted in the breadcrumb or drill down path. Here we see the report is now showing only for a single sales person and that we are including the detail display. The Detail is shown as filtered because the Invoice Date column is filter as noted above.
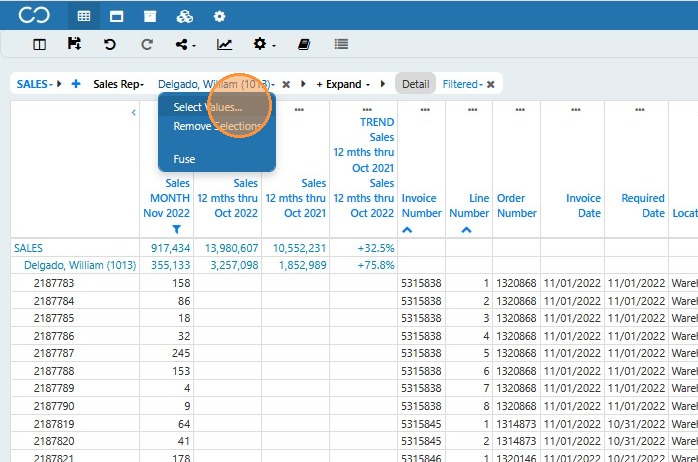
- The selection tools in the breadcrumb can be used to see all of the detail lines for all (or some selection) of the Sales Reps by clicking on the blue box next to Sales Rep and choose to remove the selection or to modify the selection.
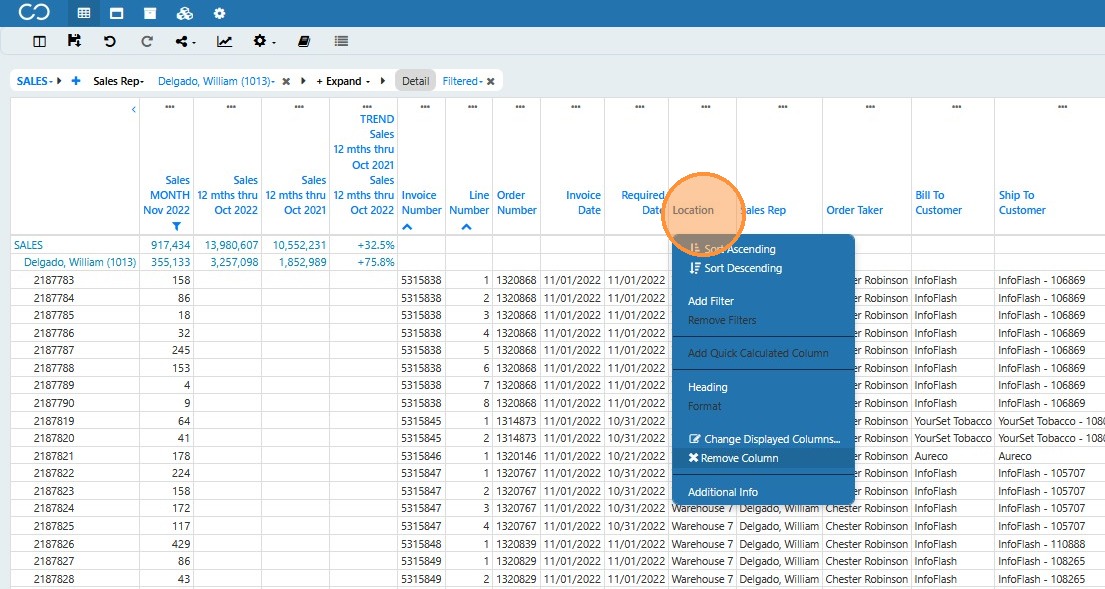
- Once the Detail Lines have been added to a report, they will remain until you choose to remove them. This can be done by clicking on any of the column headers and selecting Remove.
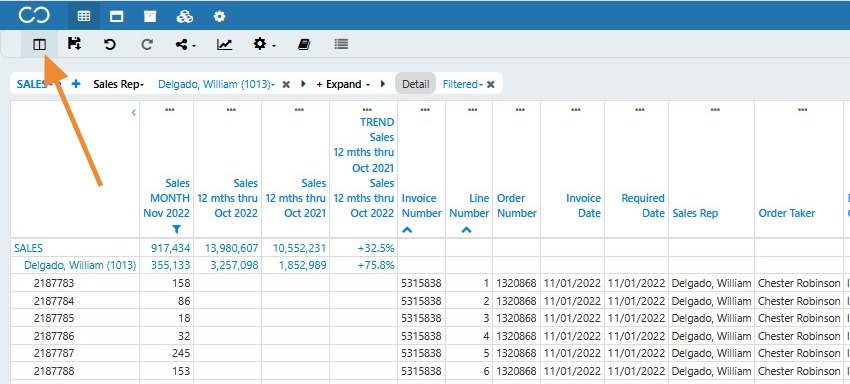
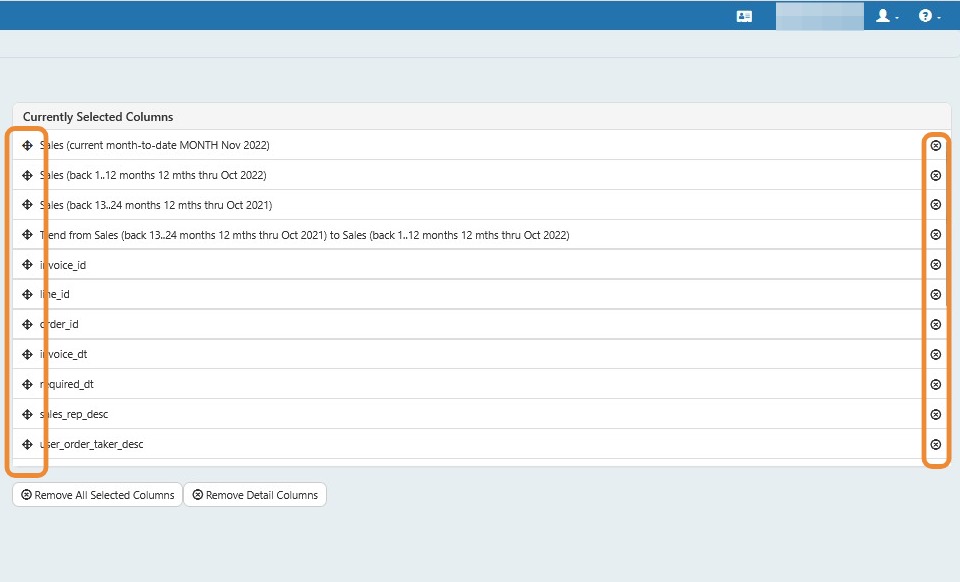
- Or you can open the column selector and remove a column by clicking the X icon on the right side of the column name. Columns can be rearranged by dragging and dropping using the arrow icon to the left of the column name.
- You can also click Expand to add to the drill down information and see more details, such as Product details or Accounts.
Note: Detail Display is not currently available for charting.
Comments
0 comments
Please sign in to leave a comment.